


You may have noticed that I commonly say “radar data” rather than “radar imagery.” This is because it is very different from optical imagery, but it can still be interpreted and used with a little extra training. Radar provides much more information than just an image to be visually analyzed. Indeed, most remote sensing experts would agree that radar data has an inherently higher information content that optical imagery. I commonly extract several information layers (data-derived products) from each radar dataset that I analyze.
How is Radar Data Different?
Radar data has 2 data values for each pixel, a Magnitude value and a Phase value. The values in the Magnitude layer create an image analogous to one collected by an optical sensor, although interpreting a magnitude layer has its own challenges that I discuss below. The Phase layer, however, is an information layer unlike anything that exists for other imaging sensors. It cannot be visually interpreted. ERDAS IMAGINE Operational Radar provides tools for extracting information from each of these two data layers.
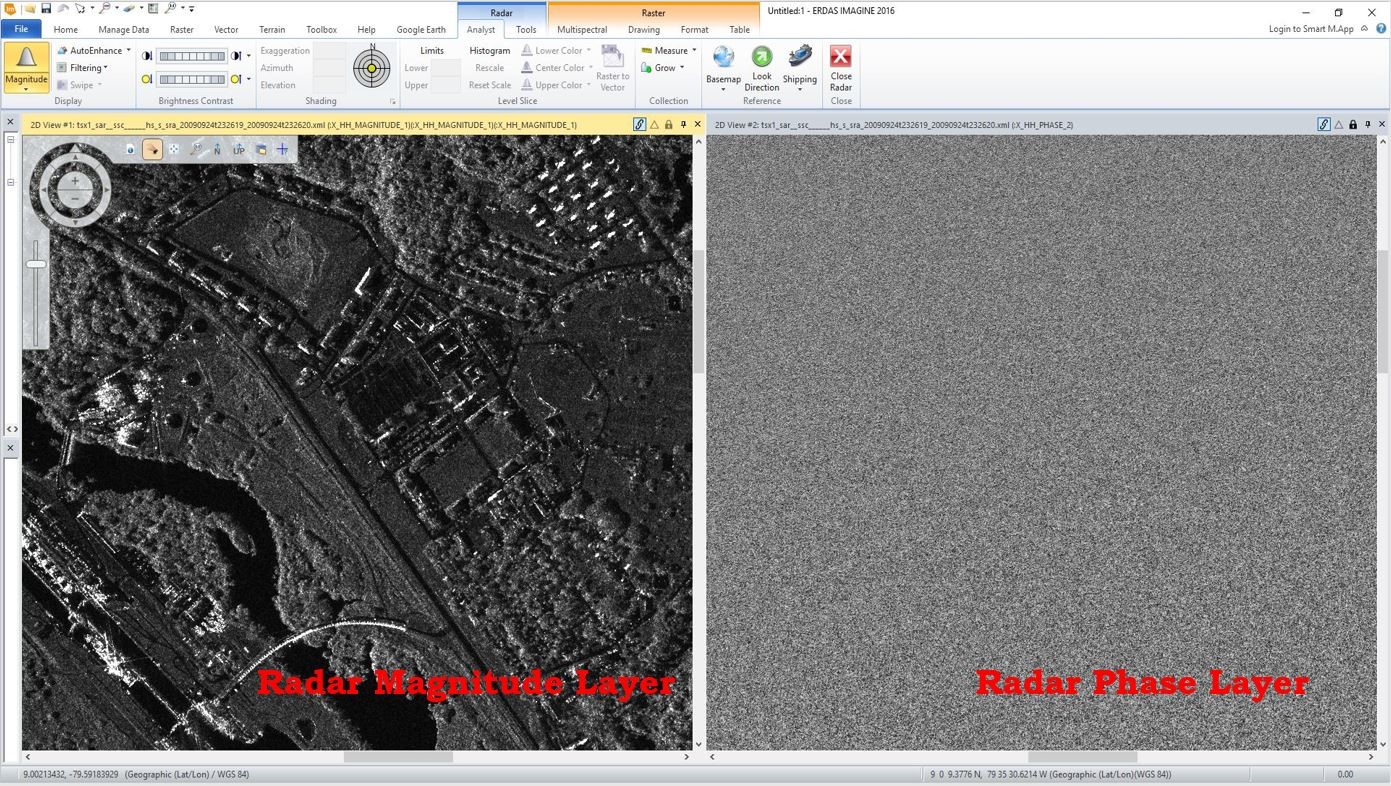
The magnitude layer is analogous to an optical image. The phase layer is pure data and is not visually interpretable.
The Magnitude Layer
The Magnitude layer, which benefits from analyst interaction, is analyzed in the Radar Analyst Workstation and the new SAR Feature Extraction module. These provide user-friendly interfaces with radar-specific tools to help you rapidly extract information and convert it to a standard format for distribution.
The Phase Layer
In contrast, the Phase layer cannot be visually analyzed. There is no optical equivalent; this is a whole new realm of information. In ERDAS IMAGINE, information is extracted from the Phase layer via the various Interferometric Wizard-workflows. While many of these Workflows present the Magnitude layer for Analyst interaction (e.g. inserting GCPs), the bulk of the information that is extracted comes from the Phase layer.
Interpreting the Magnitude Layer
Radar is an Active Sensor
When you visually interpret the magnitude layer, you need to keep two things about the sensor in mind. First, radar is an active sensor; that is, it emits its own illuminating radiation. That has advantages; because it provides its own power, it can operate 24 hours a day.
Radar is collected at an angle; always know the Sensor Look Direction
Second, radar data is collected at an angle, not at nadir (straight down) like an optical sensor. Because of this, you need to take the direction of the “radar beam” into account. This direction is known as the Sensor Look Direction. This is one of the things that interpreters can find challenging at first, although the growing popularity of oblique aerial imagery has lessened the awkwardness when optical analysts view radar data for the first time.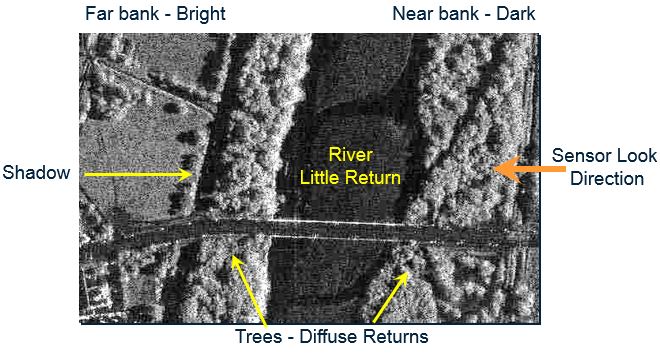
The high directionality of the signal has disadvantages. For one, radar images have very “hard” shadows because there is no diffuse illumination like with optical sensors. Areas that are not illuminated (shadow areas) are very dark and there is no weak diffuse signal to be enhanced. But it also has advantages. If we know the look direction angle and the width of the shadow, we can calculate the height of the object.
Sensor Look Direction and Feature Orientation
The direction of the emitted illumination determines how visible a particular feature will be in a radar image. For this reason, the IMAGINE Radar Analyst Workstation has a Tool which will display the sensor look direction on top of the displayed image.
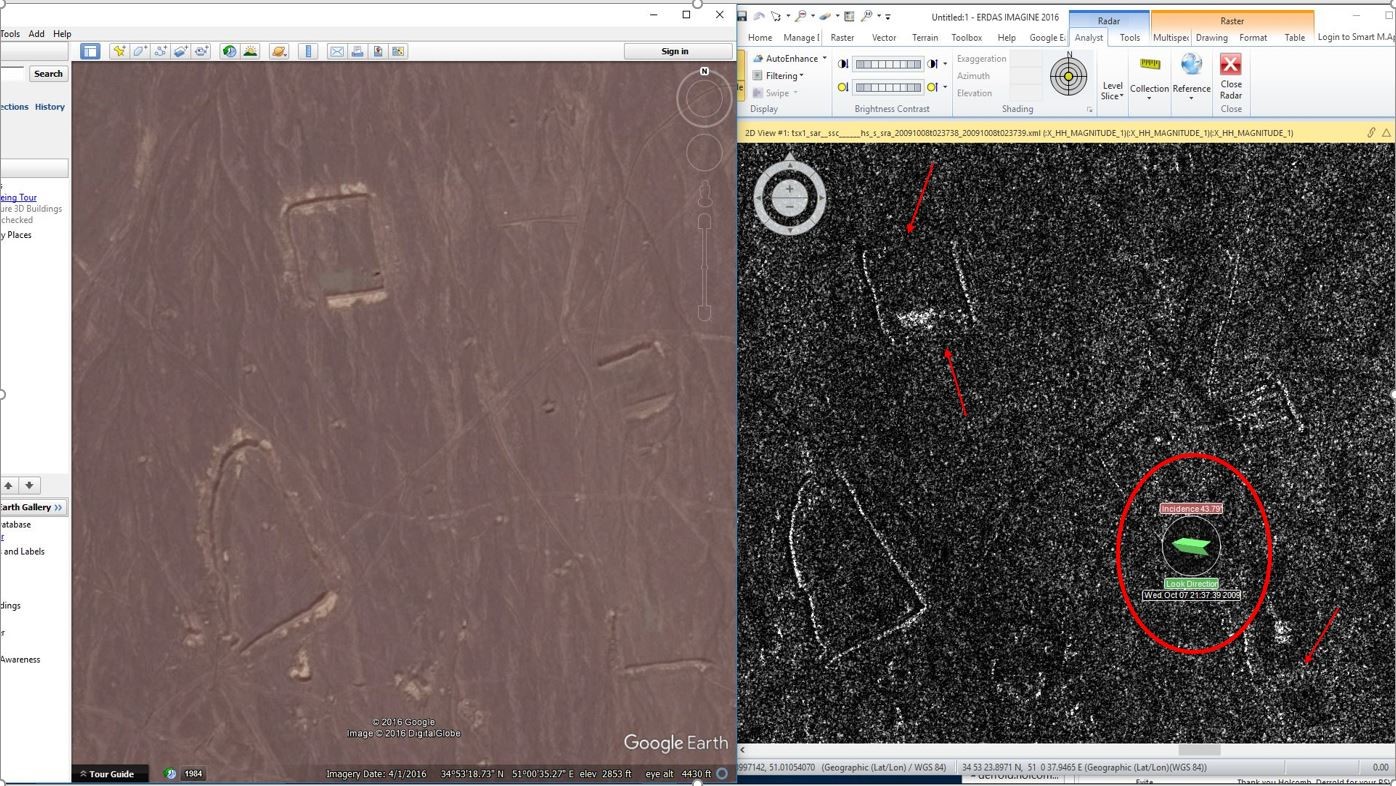
Note that walls orthogonal to the look angle appear bright while walls that parallel the signal look direction to not show up very well.
The image on the left is an optical image from Google Earth; the image on the right is radar. The green arrow of the IMAGINE Look Direction Tool, circled in the lower right, shows us a look direction slightly north of west. Notice how the linear features that are roughly parallel to the look direction are barely visible in the radar image while those that are at right angles (orthogonal) to the sensor look direction are very bright.
Finding Objects: Radar Signal Wavelength
The next most important parameter to consider when interpreting the magnitude layer is the wavelength. In a sense, this is analogous to wavelength in optical imagery and one could create a “multispectral” radar image by combining imagery from sensors emitting at different frequencies.
But when thinking about radar signal wavelength, you must have different considerations than when thinking of wavelengths in optical imagery. In radar imagery, it is less about the chemical makeup of the object on the ground – although this can come into play: metal objects reflect better than porous surfaces – and more about the physical size of the object.
The radar signal is most responsive to features or relief of about the same size as the radar wavelength. Thus, an object that is 5-6 cm in size would yield a strong return signal to an X-band radar, which has a 2-3 cm wavelength. By contrast, this object would yield a weak return to an L-band sensor, which emits wavelengths in the region of 25cm.
The exact nature of this radar-target interaction will be the topic of a future discussion.
Polarization of the Radar Signal
The polarization of the emitted and return signal in the radar data also affects your interpretation of the data. Again, there is no (operational) optical equivalent; like the Phase layer, this is something unique to imaging radar sensors. We will look at this in greater depth in a future post.
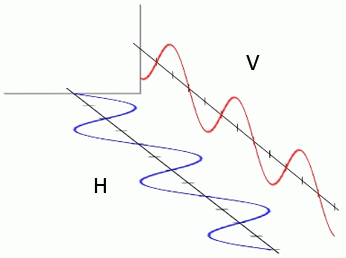
Each burst of the radar signal is emitted in a single plane, either horizontal (H) or Vertical (V).
Simply put, a radar sensor transmits the radar signal as plane-polarized electromagnetic radiation. This emitted burst can be in either the horizontal (H) or vertical (V) plane. Some sensors emit both in an alternating pattern. This signal then interacts with the surface and is reflected or scattered back to the radar sensor. This returning signal can be received in either the horizontal or vertical plane.
Some objects are more obvious to vertical signals, while others are more readily apparent in images created from horizontal signals. For example, the vertical geometry of tall standing vegetation generates a stronger return from a V polarized signal than from an H polarized signal.
To help your interpretation, you can designate the images created from the polarized data to identify the transmit and receive polarization. Thus, an HH image would be a horizontal transmit-horizontal receive while HV is horizontal transmit-vertical receive.
How can a horizontal transmit result in a vertical receive? We’ll discuss that in the future.