

On July 5th, Luciad is releasing V2018. While the visuals of Luciad were already very aesthetical in the previous versions, V2018 brings the science meets art principle to a whole new level with the new point cloud functionalities.
A Point Cloud is a 3D model made up of thousands – or even millions – of georeferenced points and hence gives an incredibly detailed representation of reality. Point clouds are typically created through 3D laser scanning techniques such as Light Detection and Ranging (LiDAR) technologies, although they can also be extracted from imagery using photogrammetric methods. Each point has its XYZ coordinates and some attributes. These attributes can represent time, flight line, intensity (how much light returns back from a point), color, classification, RGB value, etc. When lots of points are brought together into a single feature, they start to show some new qualities. And wasn’t this exactly what pointillists like Signac and Seurat intended to do?
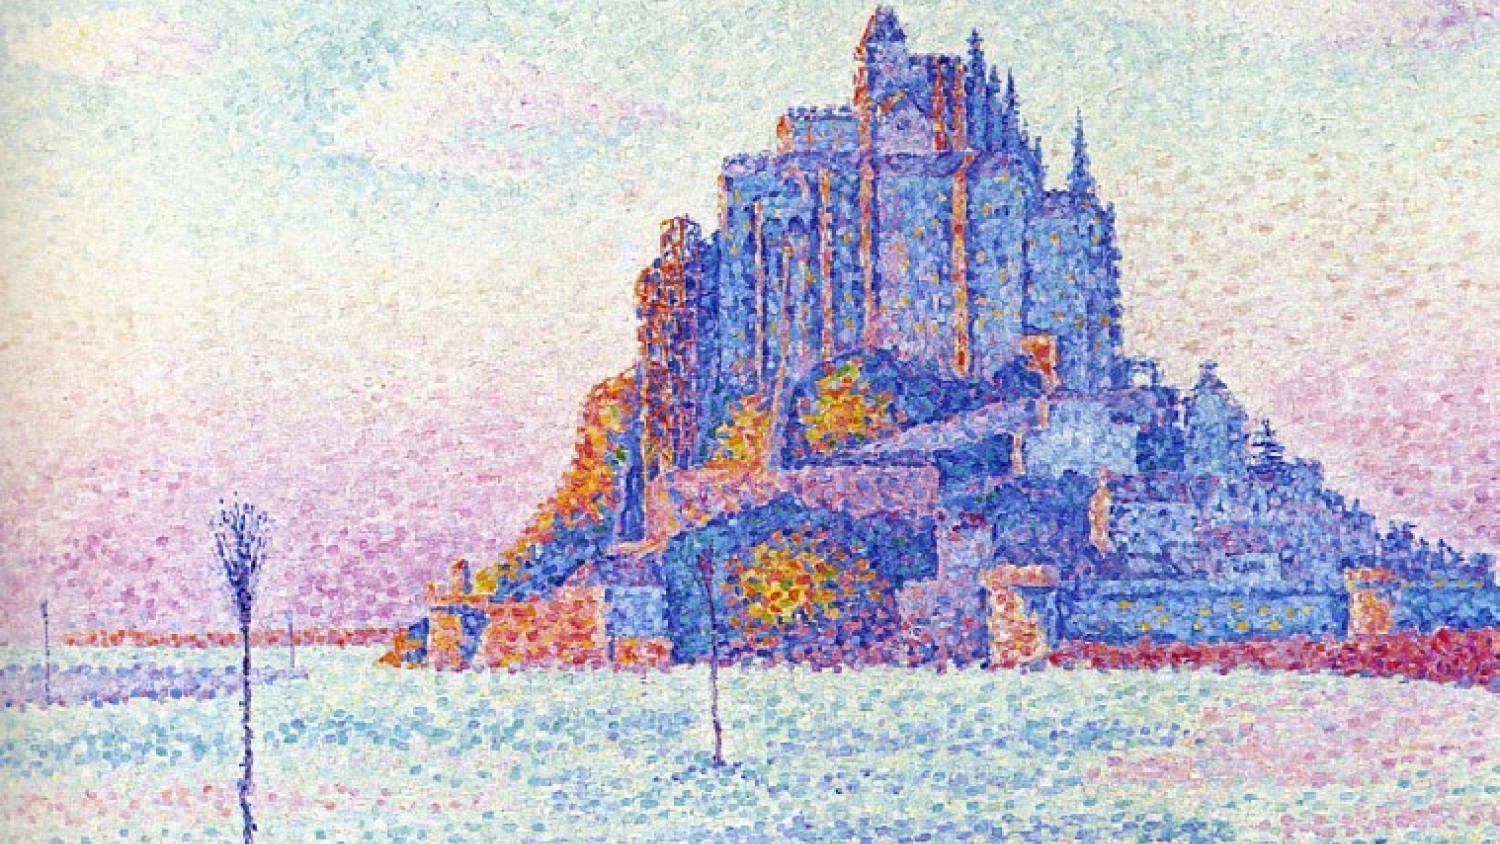
Pointillism is a painting technique practiced in France at the end of the nineteenth century. While traditional painting involves creating different hues by mixing paint colors on a palette or on the canvas, pointillists use primary colors to paint dots. The human brain observes those points, the color, and the proximity to other points and interprets them as a secondary color. For example, by putting small red and yellow dots next to each other, one can see orange. When viewed at a distance, the human eye fuses the individual dots together into areas of solid color.
This is clearly illustrated below with an image of the painting “Mont Saint Michel, fog and sun” from 1897 by Paul Signac.
Like pointillist masterpieces, point clouds are composed of a large number of points. Unlike the unarguably aesthetical aspects of pointillism, however, they also have numerous additional functionalities. Pointillist paintings are a two-dimensional representation of reality and are static in nature. Loading point clouds in Luciad V2018 gives you access to the full range of Luciad’s visualization and analysis options: view the point clouds in full 3D, seamlessly integrate the points with other data sets, such as aerial imagery and terrain data, to visualize the entire environment. You can also use expressions to style and filter the data, or measure and compare, and so on.
The video below gives another look at the Mont Saint Michel in France. A 100 GB .Las file provided by IGN France has been processed by Luciad’s server solution, LuciadFusion to create an OGC Tile service which makes this massive point cloud available in Luciad’s browser solution, LuciadRIA. LuciadRIA V2018 visualizes the Mont Saint Michel point cloud in full 3D on top of Bing Maps and Open Sea Map and allows you to measure the hight of the tower.
https://vimeo.com/272934210