

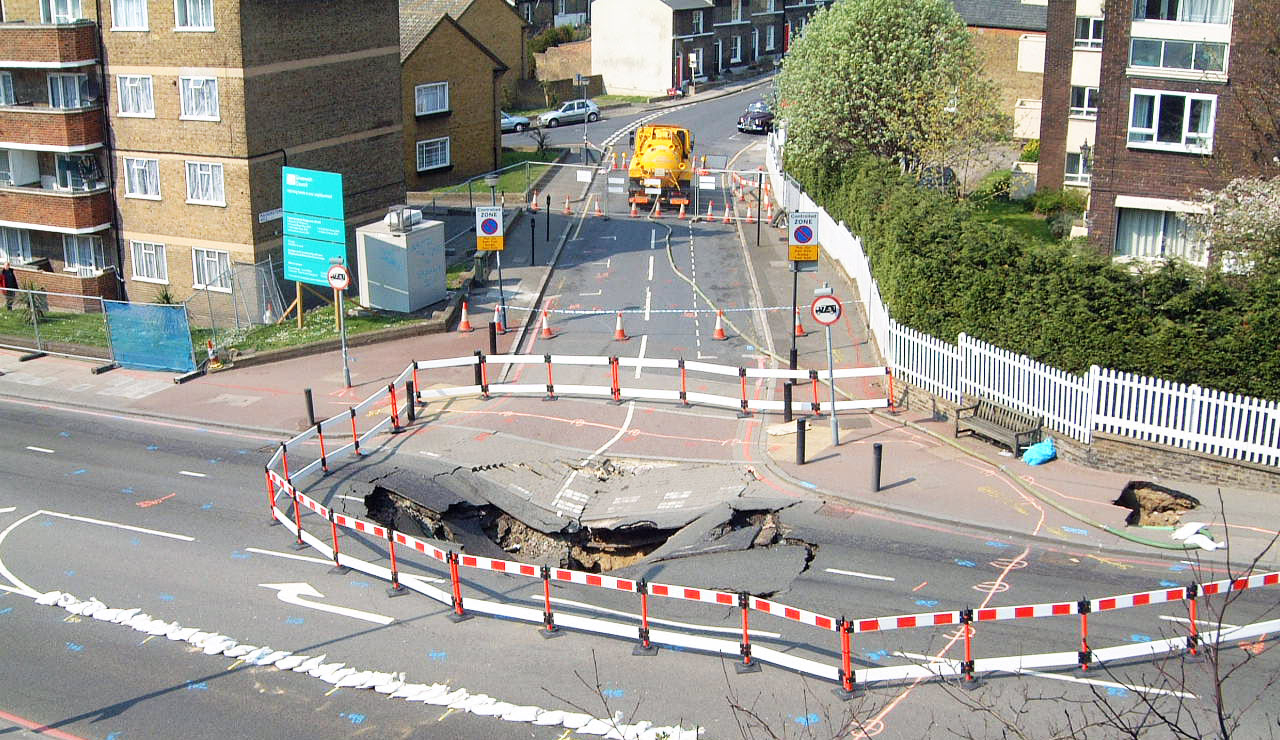
Subsidence of the Earth’s surface can have catastrophic consequences to structures, business operations, local inhabitants, and the environment.
Subsidence is the sudden sinking or gradual downward settling of the Earth’s surface due to removal or displacement of subsurface earth materials with little or no horizontal motion. The definition of subsidence is not restricted by the rate, magnitude, or area involved in the downward movement. It may be caused by natural processes or by human activities. Subsidence is a global problem, and in the United States, more than 17,000 square miles (44,000 square km) in 45 states have been directly affected by subsidence.
The principal causes of subsidence include:
- Aquifer-system compaction associated with groundwater withdrawals
- Drainage of organic soils
- Underground mining
- Natural compaction or collapse, such as with sinkholes or thawing permafrost
Why is Subsidence Mapping So Important?
Because there are a lot of real-world applications for subsidence mapping technology across multiple industries.
Hydrocarbon Extraction
Oil fields can subside due to oil and gas extraction. Using differential GPS to take pointwise measurements will not give you the big picture. There is no cost-effective way to get this information without this technology. Why is it so important? If an oil well is pumping on the site, and the ground shifts too much, the oil pipe will break. It can then cost $1 million to drill a replacement pipe. Understanding the subsidence occurring on- site and mitigating any potential damage to infrastructure, the environment, injury to personnel or lost production, is vital.
Mining
Monitoring subsidence is extremely important in the mining industry. On-site operators are at potential risk all the time. It would be a huge liability for any organization if they did not monitor their site for subsidence. At the same time, many government agencies also monitor current and abandoned mining operations because in cities like Cologne and Paris, mining has been going on for centuries. These modern cities have old mines beneath them, and it is important to monitor what is happening underground to keep citizens and infrastructure safe.
City Services Infrastructure
Anytime you have water or sewage flowing through pipes underneath a city’s roads and infrastructure, the danger of a ground collapse is quite real. Natural gas pipes are especially risky because a broken natural gas pipe could cause an explosion. Using time-series subsidence data allows city officials to direct their mitigation resources to the highest priority geographic locations in a cost-effective and timely way.
Critical Infrastructure (Dams, Power Plants)
A power plant is a good example of critical infrastructure. For example, a mine may be located near a power plant. If shafts, tunnels, or excavations from the mine were to collapse, it would be catastrophic not only to the mine, but to the power plant structure because of its proximity to the mine. Monitoring such scenarios is critical.
Water Aquifer Monitoring
More than 80 percent of the identified subsidence in the United States is a consequence of our exploitation of underground water, and the increasing development of land and water resources threatens to exacerbate existing subsidence problems and initiate new ones. In many areas of the arid Southwest, and in more humid areas underlain by soluble rocks such as limestone, gypsum, or salt, land subsidence is an often-overlooked environmental consequence. and may result in permanent damage to the water producing formation. Monitoring subsidence during these operations is key to maintaining the integrity of ground structure.
More Real-World Applications that can Benefit Greatly from Subsidence Monitoring
- High-speed rail tracks
- Motorways / Interstate highways / Bridges
- Tunneling
- Large-scale agriculture operations
- Earthquake prediction
- Landslide prediction and mitigation
Subsidence Mapping Makes the Transition from Research to Real-World Applications
Subsidence mapping is a very sophisticated technology that has made the transition from research to real-world applications. In this blog, we highlight some of these applications to emphasize the need for this technology. Using time-series displacement maps with a high point density for monitoring and mitigating subsidence due to subsurface extraction of resources such as water or hydrocarbons is a very cost-effective solution.
The technology used to detect and map land-surface deformation over a period of time is known as differential interferometric synthetic aperture radar (DInSAR). DInSAR uses repeat-pass radar images from Earth-orbiting satellites to monitor subsidence, or other displacement, in incredible detail. Once subsidence is identified and mapped, analyzing DInSAR data improves an organization’s understanding of the subsidence processes occurring on the site in question. A combination of scientific understanding and careful natural-resource management can minimize subsidence that results from developing land and water resources.
How This Very Precise Science and Mathematics Technology Works
Monitoring time-series motion using a satellite in space allows for multidimensional displacement analysis. In other words, all 3 dimensions are considered. Not only potential subsidence and inflation, but also north, south, east, and west directional movement. This technology is often termed Persistent Scatterer Interferometric Synthetic Aperture Radar – Subsidence Mapping.
- Synthetic Aperture Radar (SAR) imagery is produced by reflecting radar signals off a target area and measuring the two-way travel time back to the satellite.
- A strong Scatterer – such as a metal roof, power pole, or a big boulder in the countryside, always gives a strong radar return – the object is said to be persistent.
- Persistent – always there, always strong, always appears in image after image – over a long period of time, even over years. We can very precisely measure the 3-dimensional location of these persistent scatterer objects in image after image over periods of time. The technology we use is called Interferometry, which means we are looking at the interference pattern of the phase of the radar signal.
- This technology is also called Permanent Scatterers or Time Series Differential InSAR.
- As Time Series Differential InSAR implies, dozens of images are captured over a period of time for the analysis.
- Because the persistent objects occur consistently in the image series, their locations can be continuously determined. From this collection of points, which could number in the thousands, the Displacement Map can be derived.
Hexagon Can Help with Your Organization’s Subsidence Mapping Needs
ERDAS IMAGINE software from Hexagon has a DInSAR Wizard Workflow Tool that can be used to monitor areas of interest for “hotspots” of potential subsidence. This product is easy to use and cost-effective. Combining this routine monitoring software with analysis from Hexagon’s Geospatial division partner Planetek Italia, who has extensive DInSAR expertise, allows us to deliver detailed Subsidence Maps as a Service. When the Service is completed, the Subsidence Map is delivered via Hexagon M.App Chest and can then evaluated and exploited within ERDAS IMAGINE. The necessary tools and interfaces are fully integrated.
Learn how this is implemented in the case study, Building a Simple Answer to a Complicated Subsidence Problem.