


Landslides can destroy ecosystems, damage property and even cause injury or death. When they occur inside of a mine, the risks are even greater. So, what if we had the ability to detect the amount of damage caused, or even know the likelihood of landslide phenomena before one occurs? Fortunately, that technology does exist, and it’s available for use right now.
GEOSYSTEMS HELLAS SA, a Hexagon Geospatial partner and services provider in Greece, has demonstrated this process in a recent white paper titled, “Utilizing Free Use Satellite Images and Remote Sensing Software to Detect Landslides.” They documented the possibility of using free and openly accessible data from the European Union’s Copernicus program in combination with our ERDAS IMAGINE remote sensing software. The result: Four ways of verifying landslide phenomena or analyzing areas for the likelihood of an occurrence.
The Amyntaio Mine Landslide
To exemplify the process, GEOSYSTEMS HELLAS SA used before-and-after images of a major landslide in Amyntaio, a town located in Macedonia, Greece. The landslide occurred June 10, 2017.
The images were selected from Copernicus’ Sentinel-1 radar data and Sentinel-2 optical data. With a series of algorithms and processes in ERDAS IMAGINE, the data was converted into change detection maps to present actionable information.
Sentinel-1 Data
The radar images were processed using two methods in ERDAS IMAGINE: The first used the Magnitude layer, while the second used the Phase layer.
With radar data, the Magnitude layer is similar to what we think of as an “image.” After employing the Radar Analyst tool and Blue is New algorithm on the radar datasets, the landslide was visible once the image was zoomed-in.
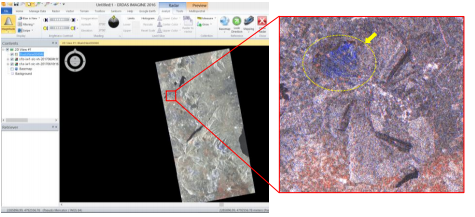
The blue pixels provide a visual indication of where pixel values change between the magnitude images.
In comparison, the Phase layer doesn’t resemble an image, but employing algorithms can convert the data into a usable visual. First, the Coherence Change Detection (CCD) algorithm and Interferometry tool were used to identify changes in elevation represented in the data to within a few millimeters. Then, a Multitemporal Coherence map (MTC) was created with the before-and-after images to showcase change.
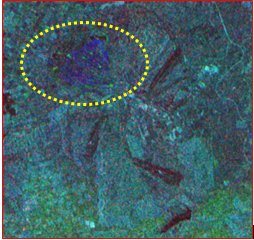
The dashed ellipse indicates where the greatest amount of change occurred between the phase data.
Sentinel-2 Data
With this dataset, the before-and-after data was layer-stacked to create RGB-NIR images. These images used Band 2, Band 3, Band 4 and Band 8 of 13 spectral bands.
The optical images were processed using direct image processing and machine learning.
With direct image processing, the two RGB-NIR images were combined with an area of interest and modified with the Site Monitoring algorithm to create the change detection map.
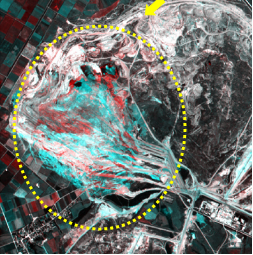
Areas of red and blue indicate places where significant change occurred.
Machine learning, like IMAGINE Objective, can automatically detect changes in datasets. ERDAS IMAGINE’s Raster Pixel Processor can also show how much each pixel has changed with a probability metric between 0 and 1 (with values closer to 1 indicating the most change).
ERDAS IMAGINE’s viewer can be used to view the change detection.
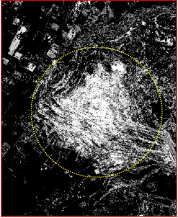
The pixels with the highest probability of change appear brighter in the output image.
By using these processes in supervising mines and other landscapes, mine supervisors can create a safer environment and reduce the risk of injury or property damage.