


Understanding the Indicators of Wildfire Through Mapping
Soon, wildfire season will return to the western United States of America, and federal forecasters are warning that the 2019 wildfire season could be even more devastating than last year. October is usually the worst month for seasonal wildfires, but higher temperatures and continued drier weather extend the timeline for taking wildfire precautions.
The 2018 wildfire season was devastating in California, killing dozens of people and causing billions of dollars of property damage. The Mendocino Complex fire was the largest, destroying more than 700 square miles.
Jeff Rupert, director of the Office of Wildland Fire for the Interior Department, stated, “It’s hard to imagine a repeat of this experience, but this is the potential reality that we face again this year.” He went on to say, “It’s difficult for me to sit here this morning and say that a challenging year is ahead of us, because the wildfires that we’re now experiencing are consistently more destructive than they’ve ever been.”
Putting Technology to Work to Prevent and Mitigate Wildfires
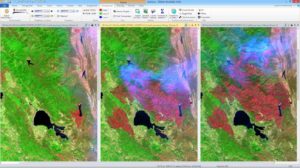
Landsat-8 imagery dated (left to right) 26 July, 11 August, and 27 August 2018 of the Mendocino Complex fires, California
Today, the United States National Weather Service (USNWS) employs many technologies in attempting to stay ahead of the fire. This includes the Wildland Fire Assessment System, where more than 1,500 weather stations across the country add their respective data regularly. Access to this data would be especially beneficial to all first responders and disaster response organizers.
The USNWS uses this and other environmental information to determine when conditions are highly favorable for extreme, uncontrolled wild fires. When these conditions are identified, a “Red Flag Warning” can be issued to regional fire departments and municipalities so they can immediately implement restrictive fire bans and forest preparation measures.
Another important source in predicting wildfires is data-driven mapping software. These mapping tools index the amount of Live vs. Dead Fuel Moisture in any given area. Fire is dependent on dead vegetation as its fuel to burn. This software inputs soil and vegetation moisture data and provides a visual map showing problem areas so researchers can better identify potential “hotspots.” Available data also includes fire danger rating mapping, which uses historical weather data to predict future weather behavior.
This ability to proactively detect the likelihood of a fire was the inspiration for Prometeo, an algorithm that detects fire probability in an area of interest. By analyzing vegetation and moisture content, as well as meteorological data, the algorithm calculates fire probability, and results are delivered to desktop or mobile devices for strategists to access in the office or the field.
It is also important to map the range of wildfires both during the event and in the aftermath. Range mapping is critical to assist in the efforts of fighting the fire, making crucial evacuation decisions, and identifying potential damage resulting from both the fire itself and its mitigation. These fires are life-threatening, inaccessible, huge, and constantly moving. Using remotely-sensed data is the only safe, timely, and accurate way to map them.
Satellite and drone imagery is more accessible than ever to remote sensing imagery analysts and has proven to be an important resource for mapping fire extent. ERDAS IMAGINE remote sensing software produces thematic maps of burn extent (or of categorized burn severity) and utilizes Normalized Burn Ratio as well as other indices to provide vital information to not only first responders and clean-up crews, but also to give predictors the tools they need to get ahead of the wildfire season.
See more solutions for proactively managing natural threats.