

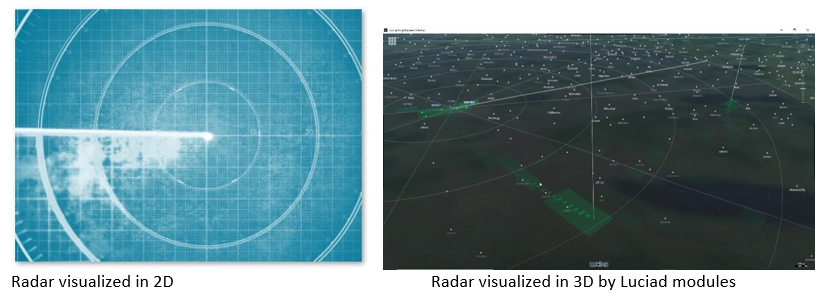
The archetypical blip on the screen of a radar swipe. Most of us recognize the green spots tracking at a snail’s pace on a dark screen, the way that radar tracks have typically been visualized for decades.
Radar and sonar manufacturers and systems integrators face a great challenge: how to improve the visualization of those green blips to bring more accurate, up-to-date information to the analyst who is interpreting the information, while also meeting other equally important requirements of the user agencies. The manufacturers and systems integrators want to strike a balance between hardcoded and softcoded software.
There’s the military or civilian end user, who wants an attractive user experience as well as high performance. The visual has to be fast, with no flickering. Users have to get the information they need – on the spot. They also want to combine the data from a radar sensor together with other data, and they want to do advanced analytics.
Radar and sonar manufacturers build high-end, expensive hardware equipment. While they must strike a balance between the high costs and the end-user experience, the manufacturers pay less attention to the end-user visualization. They are primarily focused on whether the radar works correctly or not and reflecting the different moving points; they are not as concerned with adding additional data sources.
Is there a way to improve radar and sonar end-user visualization without ditching your current solution? With Luciad technology, you can enhance your existing system by using our reusable set of software components on top of your current solution. With the Luciad platform, you can bring the static and dynamic worlds together. In other words, if your current system is handling only static data, with Luciad technology, it will also be able to handle dynamic data.
Luciad technology is not a closed solution. On the contrary, it is a set of independent and reusable software components that provide the benefit of important features such as 2D/3D visualization, hardware acceleration, and reliance on industry standards.
In the Luciad technology approach, you can choose from a number of independent modules to fulfill your specific needs. For example, let’s say you want to multiply the number dynamic tracks that your application shows. In this case, you can add our Real Time component to your system.
If you want to visualize military symbology from NATO or the United States Department of Defense, you can add our Defense module to your system. By adding these or other components we offer on top of your current system, you will have a new hardware-accelerated performant solution, without reinventing the wheel.
Ready to learn how you can fuse multiple data sources for real-time analytics and advanced visualization to enhance your users’ mission-critical operations? Watch the webinar!