


Imagine that you inherited a piece of property. Your documentation displays a map of cleared land, yet when you arrive, all you can see for miles is forest land. How do you determine what part of the forest is your inheritance?
Using cadastral data can help solve this and similar problems. Cadastral data is information used in municipalities that provides comprehensive property information, including geographic extent.
According to Oscar Soto Álvarez, a student of Autonomous University of The State of Mexico, several administrative entities in Mexico do not have an updated cadastral inventory, primarily due to a lack of equipment and technology.
After looking at some of the available data for the city of Celaya, he saw that the rights and interests contained in the land records provided a history of land use, ownership, taxation information, and more. He also noticed that Celaya was spatially growing, but the changes were not being recorded.
Gathering Multi-Source Imagery for Use with ERDAS IMAGINE
Oscar used ERDAS IMAGINE to automate the identification of constructional changes in the cadastral data using spatial-temporal images. Oscar’s project, Spatial Analysis Applied to the Cadastral Update in Region XV Celaya, Mexico, was completed as part of the (previous) partnership between Hexagon’s Geospatial division and the Digital Globe Foundation.
Oscar used images from DigitalGlobe’s WorldView-2 satellite, the GeoEye-1 Satellite, and images obtained from the DJI Mavic Pro drone for aerial validation.
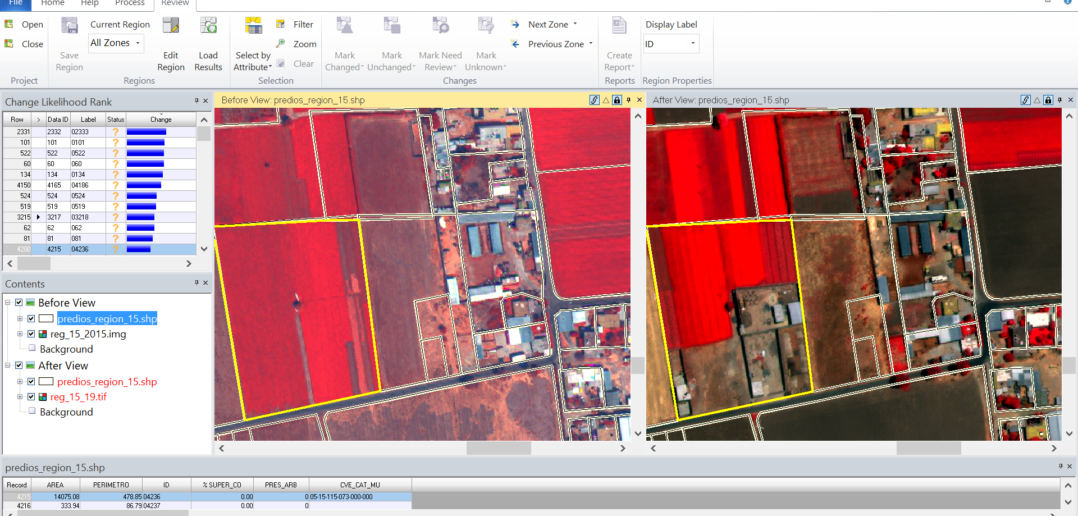
In ERDAS IMAGINE, Oscar used the PanSharpen function to increase the resolution of his multispectral and panchromatic images. He used the MosaicPro mosaicking tool to join scenes of the satellite data. He also used the AutoSync workstation to georeference the satellite images, and Supervised Classification to identify materials that were built on the roofs of buildings. Finally, he used the Change Detection Tools to determine changes on a delimited surface.
Finding the Results Hidden in the Data
Focusing on Zonal Change Detection, Oscar was able to see the spatial-temporal change in parcels by percentage, and specific modules in ERDAS IMAGINE were used to validate the results.
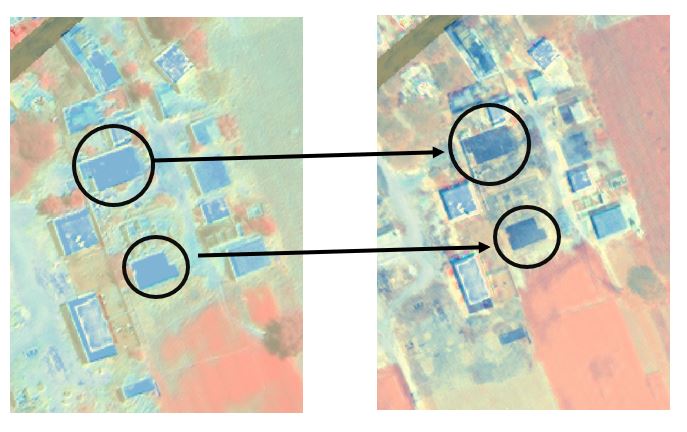
Using the Image Difference operator, a raster image was created containing the reflective values comparable to the two original images which contained original digital values that range from -2047 to 2047. With this it was assumed that a higher level of reflectance equals a greater possibility of change, however, some surfaces are not entirely highly reflective, so there is some margin for error.
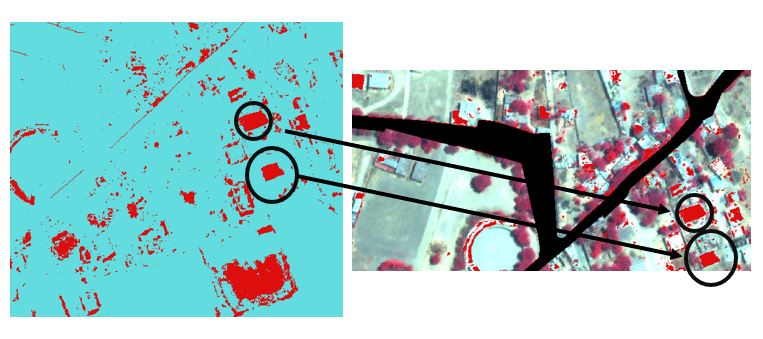
The Discriminant Function Change process was used to generate a raster image with Boolean values of 0 and 1, where 0 represents where there is no change and 1 where there is. The process is highly accurate in areas of low construction density, such as rural areas.
Thus, the results of the modules that were used were validated by comparing them with each other. The final results were very precise, but the least error was with the detection of zonal changes. Zonal Change Detection is highly recommended for dense urban areas, such as Latin American cities.
With ERDAS IMAGINE, Oscar was able to automate his workflow by inputting the necessary elements as a methodology for the change detection applied to spatial planning and the cadastral data.
Oscar’s research continues, but at this stage, he has successfully submitted his project to the Cadastral Office in Celaya, and he hopes they apply it in the future.
See more student research on our website.