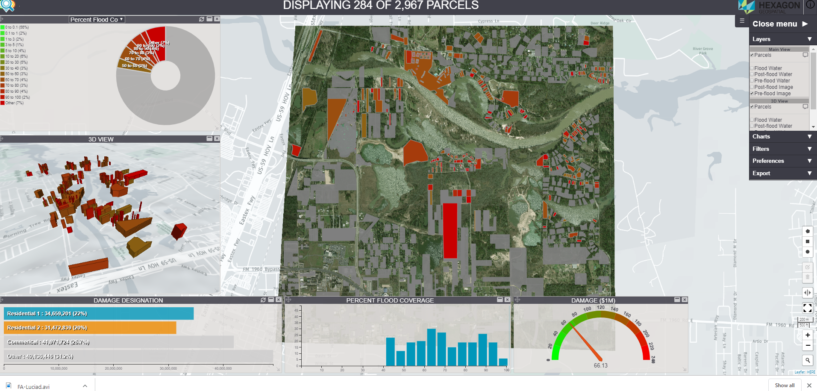
Featured image: An interactive business analytics display shows real answers about the extent of damage caused by Hurricane Harvey for an area of interest — 284 residential parcels (of 2,967 total parcels) with more than 50 percent in floodwater coverage, causing $66.13 million in damages.
—
Natural disasters happen everywhere. Often, there is nothing anyone can do to stop them, but intelligence can be implemented during and in the aftermath of the event that can lessen the impact on residents and businesses in the affected areas.
Geographic image change detection is an integral part of recovery and disaster management. Hexagon’s Geospatial division wanted to increase awareness of this capability, but to do so, they needed to demonstrate how deriving analytics from change detection processes could deliver effective responses in real-world scenarios.
Simultaneously, the Houston metropolitan area was still cleaning up the damage that Hurricane Harvey inflicted on the city in August 2017. Hurricane Harvey shares the record with Hurricane Katrina in 2005 as the costliest tropical cyclone in history, causing over $125 billion in damages. Hundreds of thousands of homes were flooded, displacing more than 30,000 people and requiring more than 17,000 rescues. There were 68 direct and 39 indirect fatalities caused by the storm. Everyone was still reeling from the hurricane and its aftermath; the event was fresh, raw, and relevant.
Learning – and Teaching – From Hurricane Harvey
In order to establish the true value of utilizing geographic image change detection in the aftermath of a disaster, Hexagon designed a workshop with Hurricane Harvey as the subject. They wanted to teach Geographic Information System (GIS) users how to create sophisticated, intelligent imagery that could be a game changer for geographic regions severely impacted by a natural disaster.
Hexagon had all the software needed to teach this, but they needed before-and-after imagery of the hurricane.
DigitalGlobe, a space imagery and geospatial content vendor, owns and operates the most agile and sophisticated constellation of high-resolution commercial Earth imaging satellites. From DigitalGlobe’s open data program specifically designed for disaster relief, Hexagon obtained all satellite images needed for the workshop
After requesting parcel data from commercial companies in Houston, Hexagon began building the Hurricane Harvey workshop.
The technical team used several Hexagon products to create a tutorial to use for the workshop. In the tutorial, to perform image-to-image change detection and to calculate six attributes pertaining to the imagery and parcel data (affected area, percentage of parcel damage, property value, and so forth), the Spatial Modeler tool for building and running geoprocessing workflows is used.
Then, dynamic charts and graphs are created from Feature Analyzer, part of the M.App Analyzer Suite, to display the resulting data. These charts and graphs are easy to analyze, slice, dice, and filter to find answers to all the questions property stakeholders would have after a significant natural disaster.
The resulting four-hour training is an easy-to-follow, yet highly technical deep dive into the benefits of using geospatial analytics to understand the impact of a natural disaster. After all the data is imported and correct settings are selected, it takes only a few clicks to filter several data points to discern specific financial implications within the data.
The Value of Proactive Disaster Management
The ability to understand the potential economic implications and prepare mitigation strategies before damage assessments have commenced is a vital tool for anyone with an interest in an area affected by a disaster.
With an interactive dashboard view such as the one from the tutorial, property managers would have immediate answers to questions such as:
- How many parcels received 25 percent of floodwater damage or more? What was the total amount of damage to those parcels in USD?
- What is the total value of company A’s parcels that are 80-100 percent floodwater damaged in USD? How many parcels were damaged?
- What is the total value of company B’s parcels with 25-100 percent square feet of water damage in USD? What percentage of Company B’s parcels have water damage?
To emphasize the value of data-driven change detection, Hexagon experts continue to teach this workshop all around the world, including to the AAG (American Association of Geographers), San Diego State University, GEO Data Design in South Africa, and with partners and professors. The Hands-On Hurricane Harvey workshop proved to be very enlightening and exciting to these geospatial enthusiasts.
Contact us for more information on how to take this tutorial yourself or to learn how Hexagon’s technology can increase the value of data for your business with advanced analytics.


